
To gain a deeper understanding of why alternative assets have such a long lockup, investors need to know about the J-curve. In the first few years of a private equity fund’s life, owners often experience negative returns due to factors such as management and professional fees, investment expenses, and underperforming or non-performing investments. Typically, by the third or fourth year, the manager begins to harvest some of the fund’s investments, and by the fifth year, the manager starts to reimburse the owners’ upfront investment.
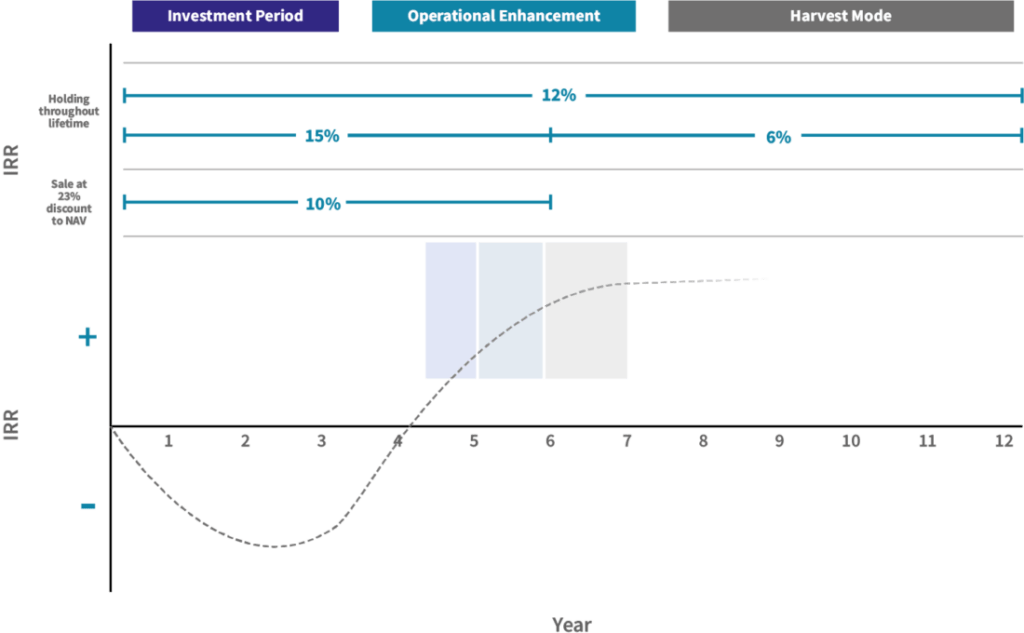
- The Illustrative J-Curve Overview chart shows how the average private equity investor realizes an annualized return of 12% over the life of a fund.
- However, looking more closely at the typical return stream of a private equity fund, the average investor realizes a 15% return during the first six years and only a 6% return in the remaining years.
- This lifecycle is called the “J-curve” because of the return dips in the early investment stage, typically followed by better returns during the operational enhancement stage; returns generally flatten out during the fund’s protracted harvest mode.
- By year six, the average fund realizes and delivers its peak rate of return based on the Net Asset Value (NAV), but the lockup period can last another six years or more. In fact, Preqin data shows the average life of a private market fund could go well beyond 12 years, and in some cases-depending on the asset class-can extend to 16 or 17 years.
Illustrative J-Curve Overview
 Source: Credit Suisse, Preqin
Note: The illustration depicts and assumes an institutionally managed diversified alternative investment earning 12% over its full life, earning 15% in its first six years and 6% in its remaining years for a total illustrative IRR of 12% over its life. An investor which sells the asset at the 6th year at a 23% discount (or 77% of NAV) would have earned approximately 10% over the 6 year holding period. This illustration assumes 2nd quartile performing funds net of fees, expenses and profit payments to sponsors investing in diversified alternative assets as tracked by Preqin. The illustration presents only a hypothetical investment outcome and does not predict future results or investment performance.

Download the full Geographic Diversification in Private Equity Markets white paper above or contact us today to discuss what Ben’s secondary market liquidity solutions could mean for you.
CONTACT INFO
CALL: 888.887.8786
EMAIL: askben@beneficient.com