
Welcome to part five of our series drawn from Ben’s latest global macroeconomic outlook, Geographic Diversification in Private Equity Markets, developed and written in partnership with Oxford Economics.
In our previous article, we discussed how Foreign Exchange (FX) risk and the challenges it poses to investing outside the U.S. can play a significant role when considering geographic diversification of private asset allocations. In this article, we bring together the many strands of our previous discussions, including FX risk, market fluctuations and forecasts, and the global macroeconomic environment, to weave them into a hypothetical scenario that demonstrates the opportunity in optimizing a portfolio for global private markets.
The Role of Market Access & Secondary Liquidity Options
To demonstrate the benefits of geographic diversification in private assets, we illustrate opportunities available to investors with broad market access and secondary liquidity options to rebalance their portfolio. A key component of a healthy portfolio is the ability to actively rebalance based on available risk/reward trade-offs across market exposures, economic development and geographies. We analyze private equity investments (buyouts/growth funds as a key private market asset class) under our baseline/downside scenarios and propose how to best use their respective characteristics across regions to develop strategic portfolio allocations. This seeks to optimize risk-adjusted performance while preserving good protection against downside events.
Investment Quality Assessment Considerations
It is generally advisable to assess the quality of an investment opportunity through risk-adjusted performance. The Sharpe Ratio is a widely used performance metric in traditional asset classes. While no similarly standard measure exists for private markets, we implicitly use risk-adjusted internal rate of return (IRR) as a core performance metric because we believe it is well-suited to private markets. A simple yet accurate way to compare risk/reward profiles of different portfolios is to plot them against a theoretical efficient frontier.
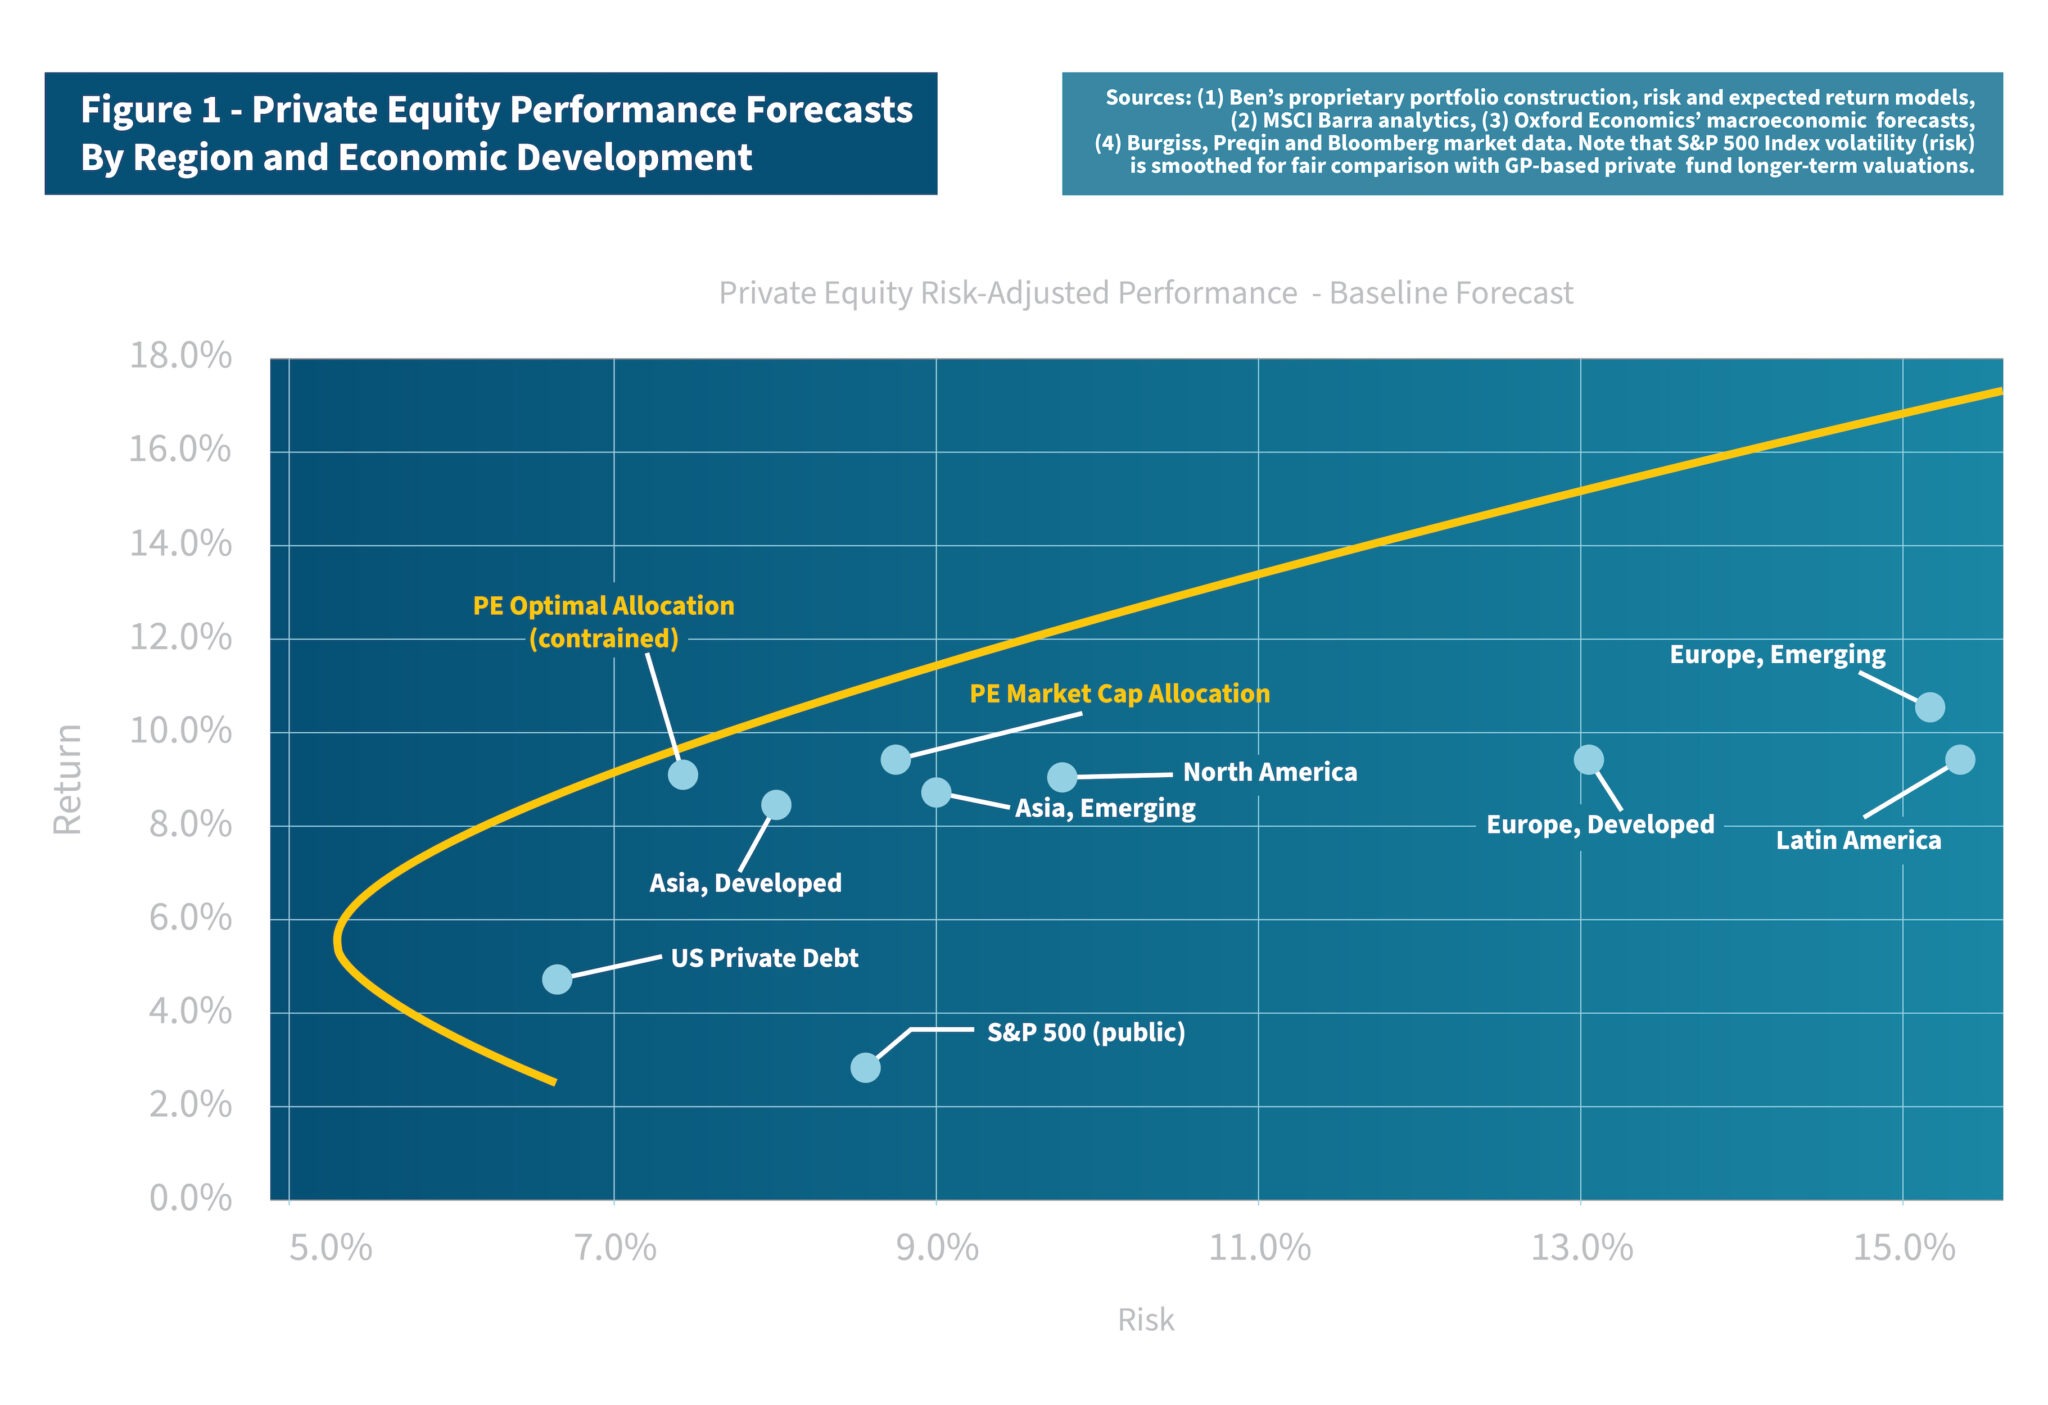
Figure 1 shows how private equity investments compare to each other across regions and economic development, and plot these against a theoretically derived “efficient frontier” using our baseline projections for both risk and return.
Portfolio Allocation – Baseline Forecasts (Private Equity)
As one can see in Figure 1, Ben currently forecasts a higher level of returns for emerging markets relative to their developed markets in each region. However, this is by no means a reliable standalone portfolio allocation metric since these higher returns often come at the expense of much higher levels of uncertainty (risk) which is typical across most emerging markets. The risk/reward efficiency level of a market segment can be assessed visually by its proximity to the overall geographic efficient frontier. To add to the complexity of finding an optimal allocation, the risk-adjusted performance per market segment does not quantify the potential diversification benefits of a global allocation on their own. This can be observed in Figure 1 by looking at the relatively low risk levels of the market cap portfolio and the optimal allocation portfolio.
Despite the historical attractiveness of private equity returns relative to public indexes, each individual geographic segment is relatively risk-inefficient from a portfolio allocation perspective. A more rewarding approach for investors with deep market access is to design a global allocation in proportions that respect an investor’s specific goals and risk appetite. Perhaps the simplest example of such a portfolio solution is to allocate following the aggregate private equity market capitalization, an important reference portfolio for large institutional asset owners.
A less constraining – and potentially more rewarding — approach for most investors is to target a geographic allocation that maximizes long-term risk-adjusted performance, which we refer to as optimal allocation in Figure 1. This portfolio is the result of a constrained optimization routine in which we allocate to regions and economic development segments in proportions that maximize the aggregate portfolio risk-adjusted returns while keeping each allocation within a range from an equally weighted reference portfolio. Allocating around an equally weighted mix avoids excessive concentration risks, from both predictable sources and unknown ones. Because of the imposed constraints, the resulting optimal geographic allocation is close to but not exactly on the efficient frontier; yet from a risk/reward perspective it remains a more efficient investment portfolio than any other alternatives.
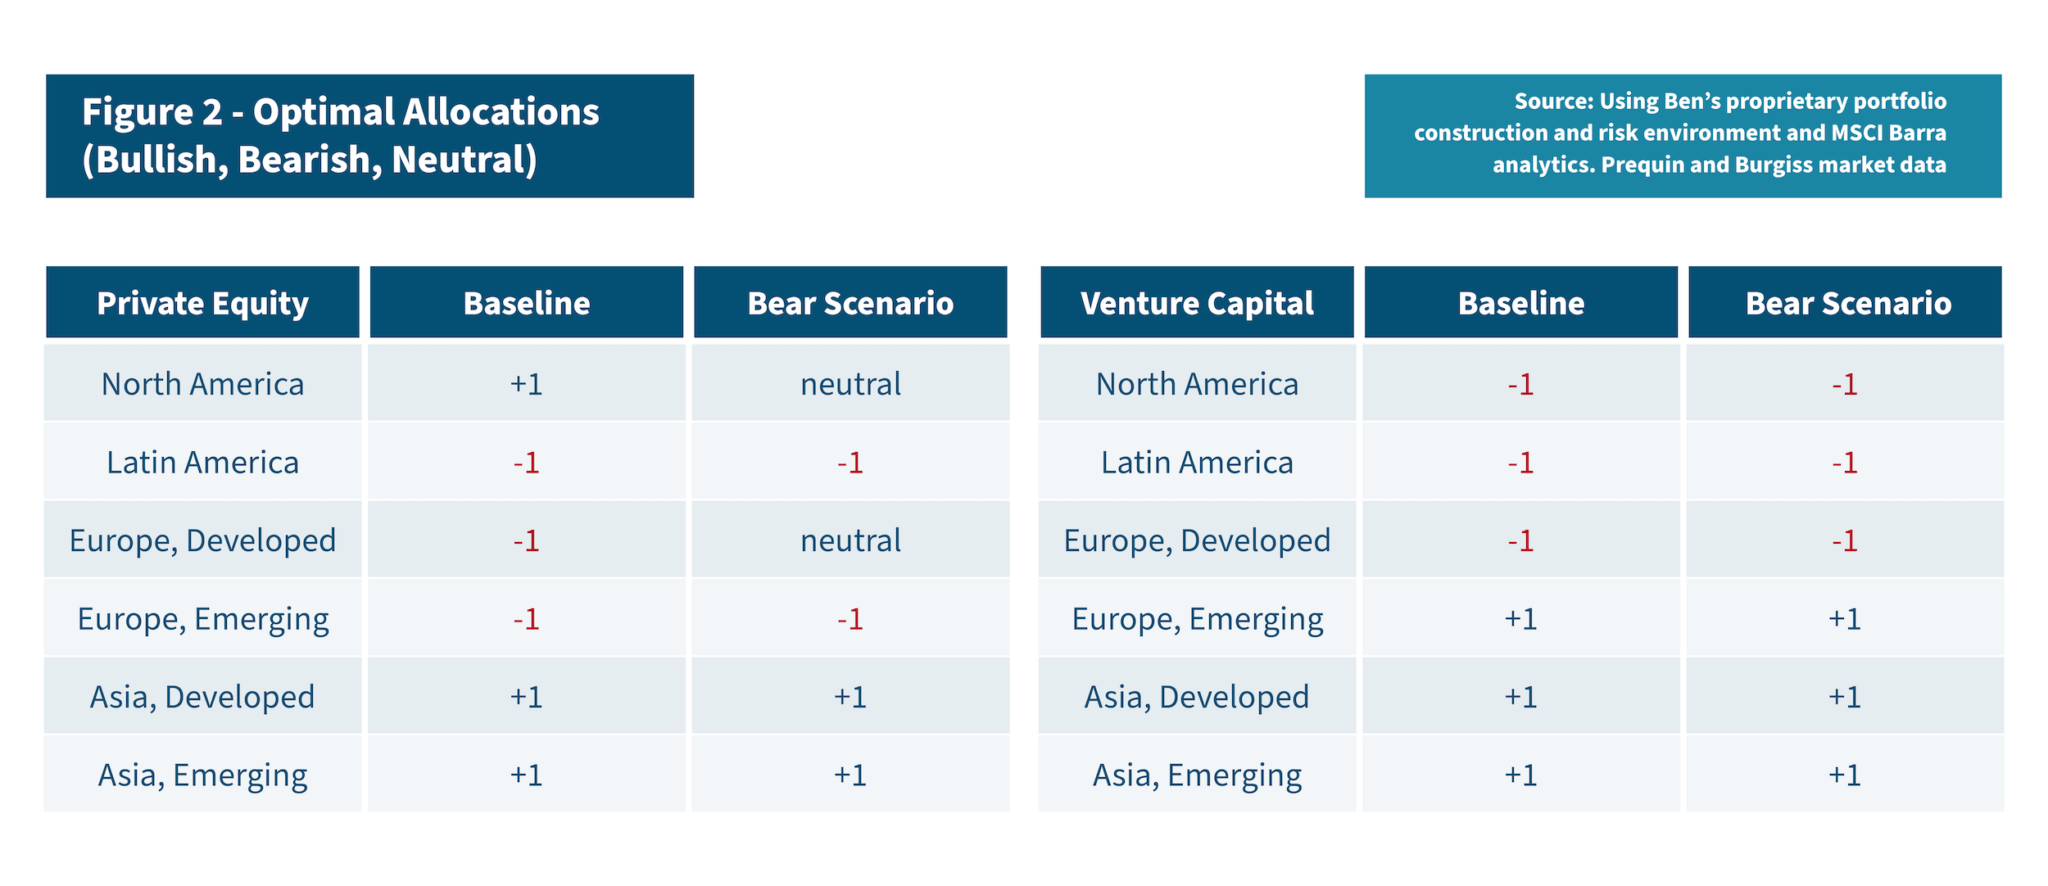
Figure 2 shows the over/under-weight of the optimal allocation relative to a simple equally weighted allocation across all regions. Latin America’s underweight is primarily based on its relatively poor risk profile, some of which is due to the elevated foreign exchange risk in various LATAM countries. Also, while we expect good returns from overall European markets as the economy bounces back from the pandemic, we expect greater downside risks across both its EM and DM economies due to the lack of policy room to accommodate shocks, justifying a broad, bearish European allocation.
Another notable observation is our general bullish stance toward Asian markets, both developed (dominated by Japan) and emerging (dominated by China). Where China’s allocation is driven by its high expected GDP growth and expanding influence in the world’s economy, Japan’s allocation ranks well because of its low expected market risk, stable economy and its diversification benefits at the total portfolio level. Modeling subtle interdependencies across different markets and capturing their correlation structures is indeed an integral part of portfolio construction.
Portfolio Allocation – Bear Scenario (Private Equity)
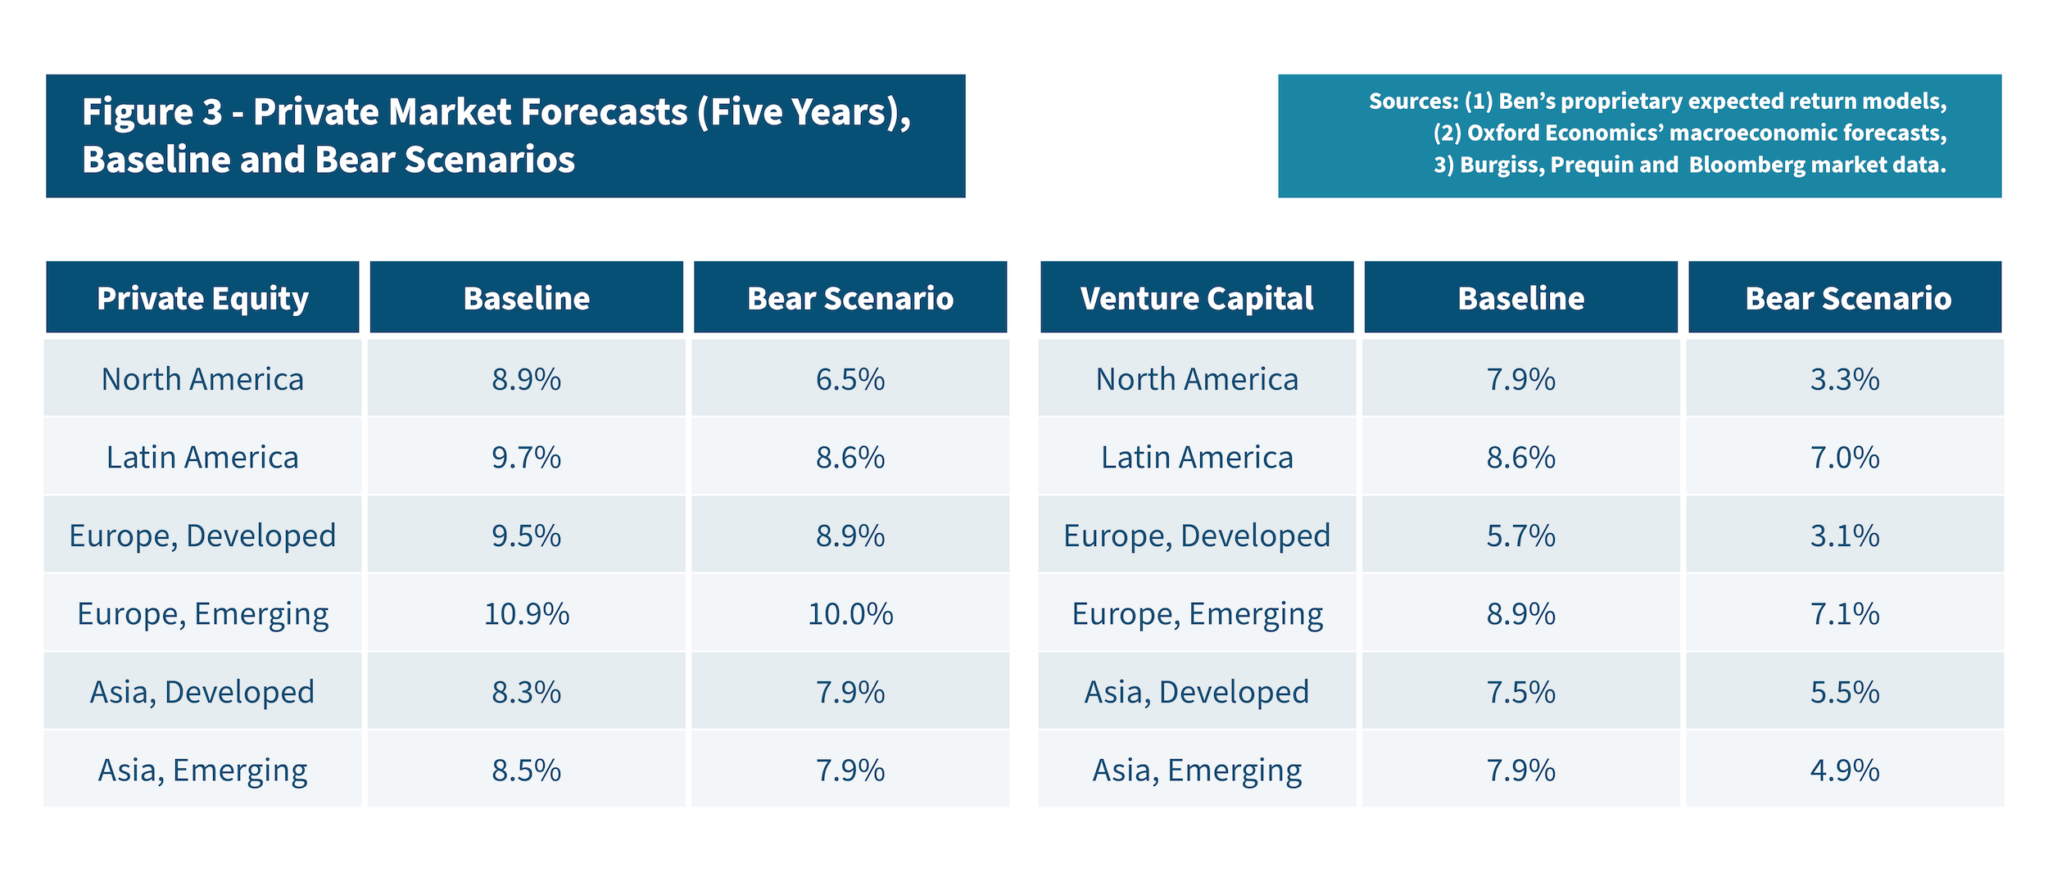
Ben’s baseline forecast is by design our highest probability scenario, but capital markets are inherently volatile and prone to unpredictable dynamics. That makes the development of an optimal allocation under a more conservative scenario a crucial exercise. Given the recent uptick in global price pressures potentially leading to less accommodative central banks across the world’s main economies, our downside scenario reflects a significant increase in inflation relative to our baseline forecast. This results in a sharp correction in bond markets and a somewhat milder one across equity markets, including private equity (Figure 3).
As can be seen in Figure 2 above, the suggested portfolio tilts under inflation-driven market stress are affecting our North American and European allocations toward a neutral stance. This reflects the relative magnitude of policy support during the pandemic as U.S. monetary and fiscal support was significantly larger than in Europe, helping to support asset prices globally.
Consequently, the removal of such support, alongside the higher inflation risk in the U.S., implies a worse outcome for U.S. assets. In aggregate due to its defensive positioning, the optimal allocation under our inflation scenario produces slightly lower returns while maintaining a healthy risk profile. As such, it is potentially better prepared to cope with both the expected and unforeseeable fluctuations of a potentially severe global recession.
Conclusion
Our analysis makes a clear case for geographical diversification in private equity markets, showing that it can help to deliver higher risk-adjusted returns. Further, our bear scenario analysis illustrates that a simple shift of allocation toward advanced economies can help mitigate key inflation risks while maintaining a high level of risk-adjusted returns.
Trust Ben™
At Ben, we have crafted a suite of reliable, ongoing liquidity solutions for investors in alternative assets. Our process seeks to give investors access to hard-earned investment capital, with liquidity provided from our own balance sheet. Contact us today to schedule a consultation with our expert team.
The information in this material is not intended to replace any information or consultation provided by a financial advisor or other professional nor shall be perceived to constitute financial, legal, accounting or tax advice.
The views and opinions expressed are those of the panelists and do not necessarily reflect the official policy or position of Ben or Oxford Economics. The information in this material is not intended to replace any information or consultation provided by a financial advisor or other professional nor shall be perceived to constitute financial, legal, accounting or tax advice.
These materials contain certain estimates, projections and forward-looking statements that contain substantial risks and uncertainties. The estimates, projections and forward-looking statements contained herein may or may not be realized, accurate or complete, and differences between estimated results and those realized may be material. Such estimates, projections and forward-looking statements are illustrative only and reflect various assumptions of Ben’s management concerning the future performance of Ben and its affiliates, and are subject to significant business, economic and competitive uncertainties and contingencies, many of which are beyond Ben’s control.
Except as otherwise noted, the materials speak as of January 2022. Neither Ben nor any of its affiliates or representatives undertakes any obligation to update or revise any of the information contained herein or to correct any inaccuracies which may become apparent.

Download the full Geographic Diversification in Private Equity Markets white paper above or contact us today to discuss what Ben’s secondary market liquidity solutions could mean for you.
CONTACT INFO
CALL: 888.887.8786
EMAIL: askben@beneficient.com